Retirement Planning • Monte Carlo • Plan Confidence
Probability of Retiring Successfully
How to interpret Monte Carlo results, plan sensitivity, quick scenarios, and spending flexibility
3 Key Takeaways
1
A 90% success probability means the plan succeeded in 90% of the Monte Carlo trials that were run.
2
A higher probability is not always better if reaching it requires unnecessarily cutting spending or delaying retirement.
3
Spending flexibility, guaranteed income, and legacy goals all affect how you should interpret the result.
Want to see how strong your retirement plan really is?
Use WealthTrace to run Monte Carlo simulations, compare quick scenarios, test spending guardrails, and see how different choices affect your plan confidence.
Start Free Trial
Run retirement scenarios in minutes.
Retirement planning software often gives you a probability of success based on Monte Carlo analysis. You might see 85%, 90%, or 95% and wonder whether that number is high enough.
It is easy to treat the result like a grade, where 95% feels better than 90% and 100% seems ideal. But the number is more useful as a way to understand risk and compare decisions.

What Does 90% Success Actually Mean?
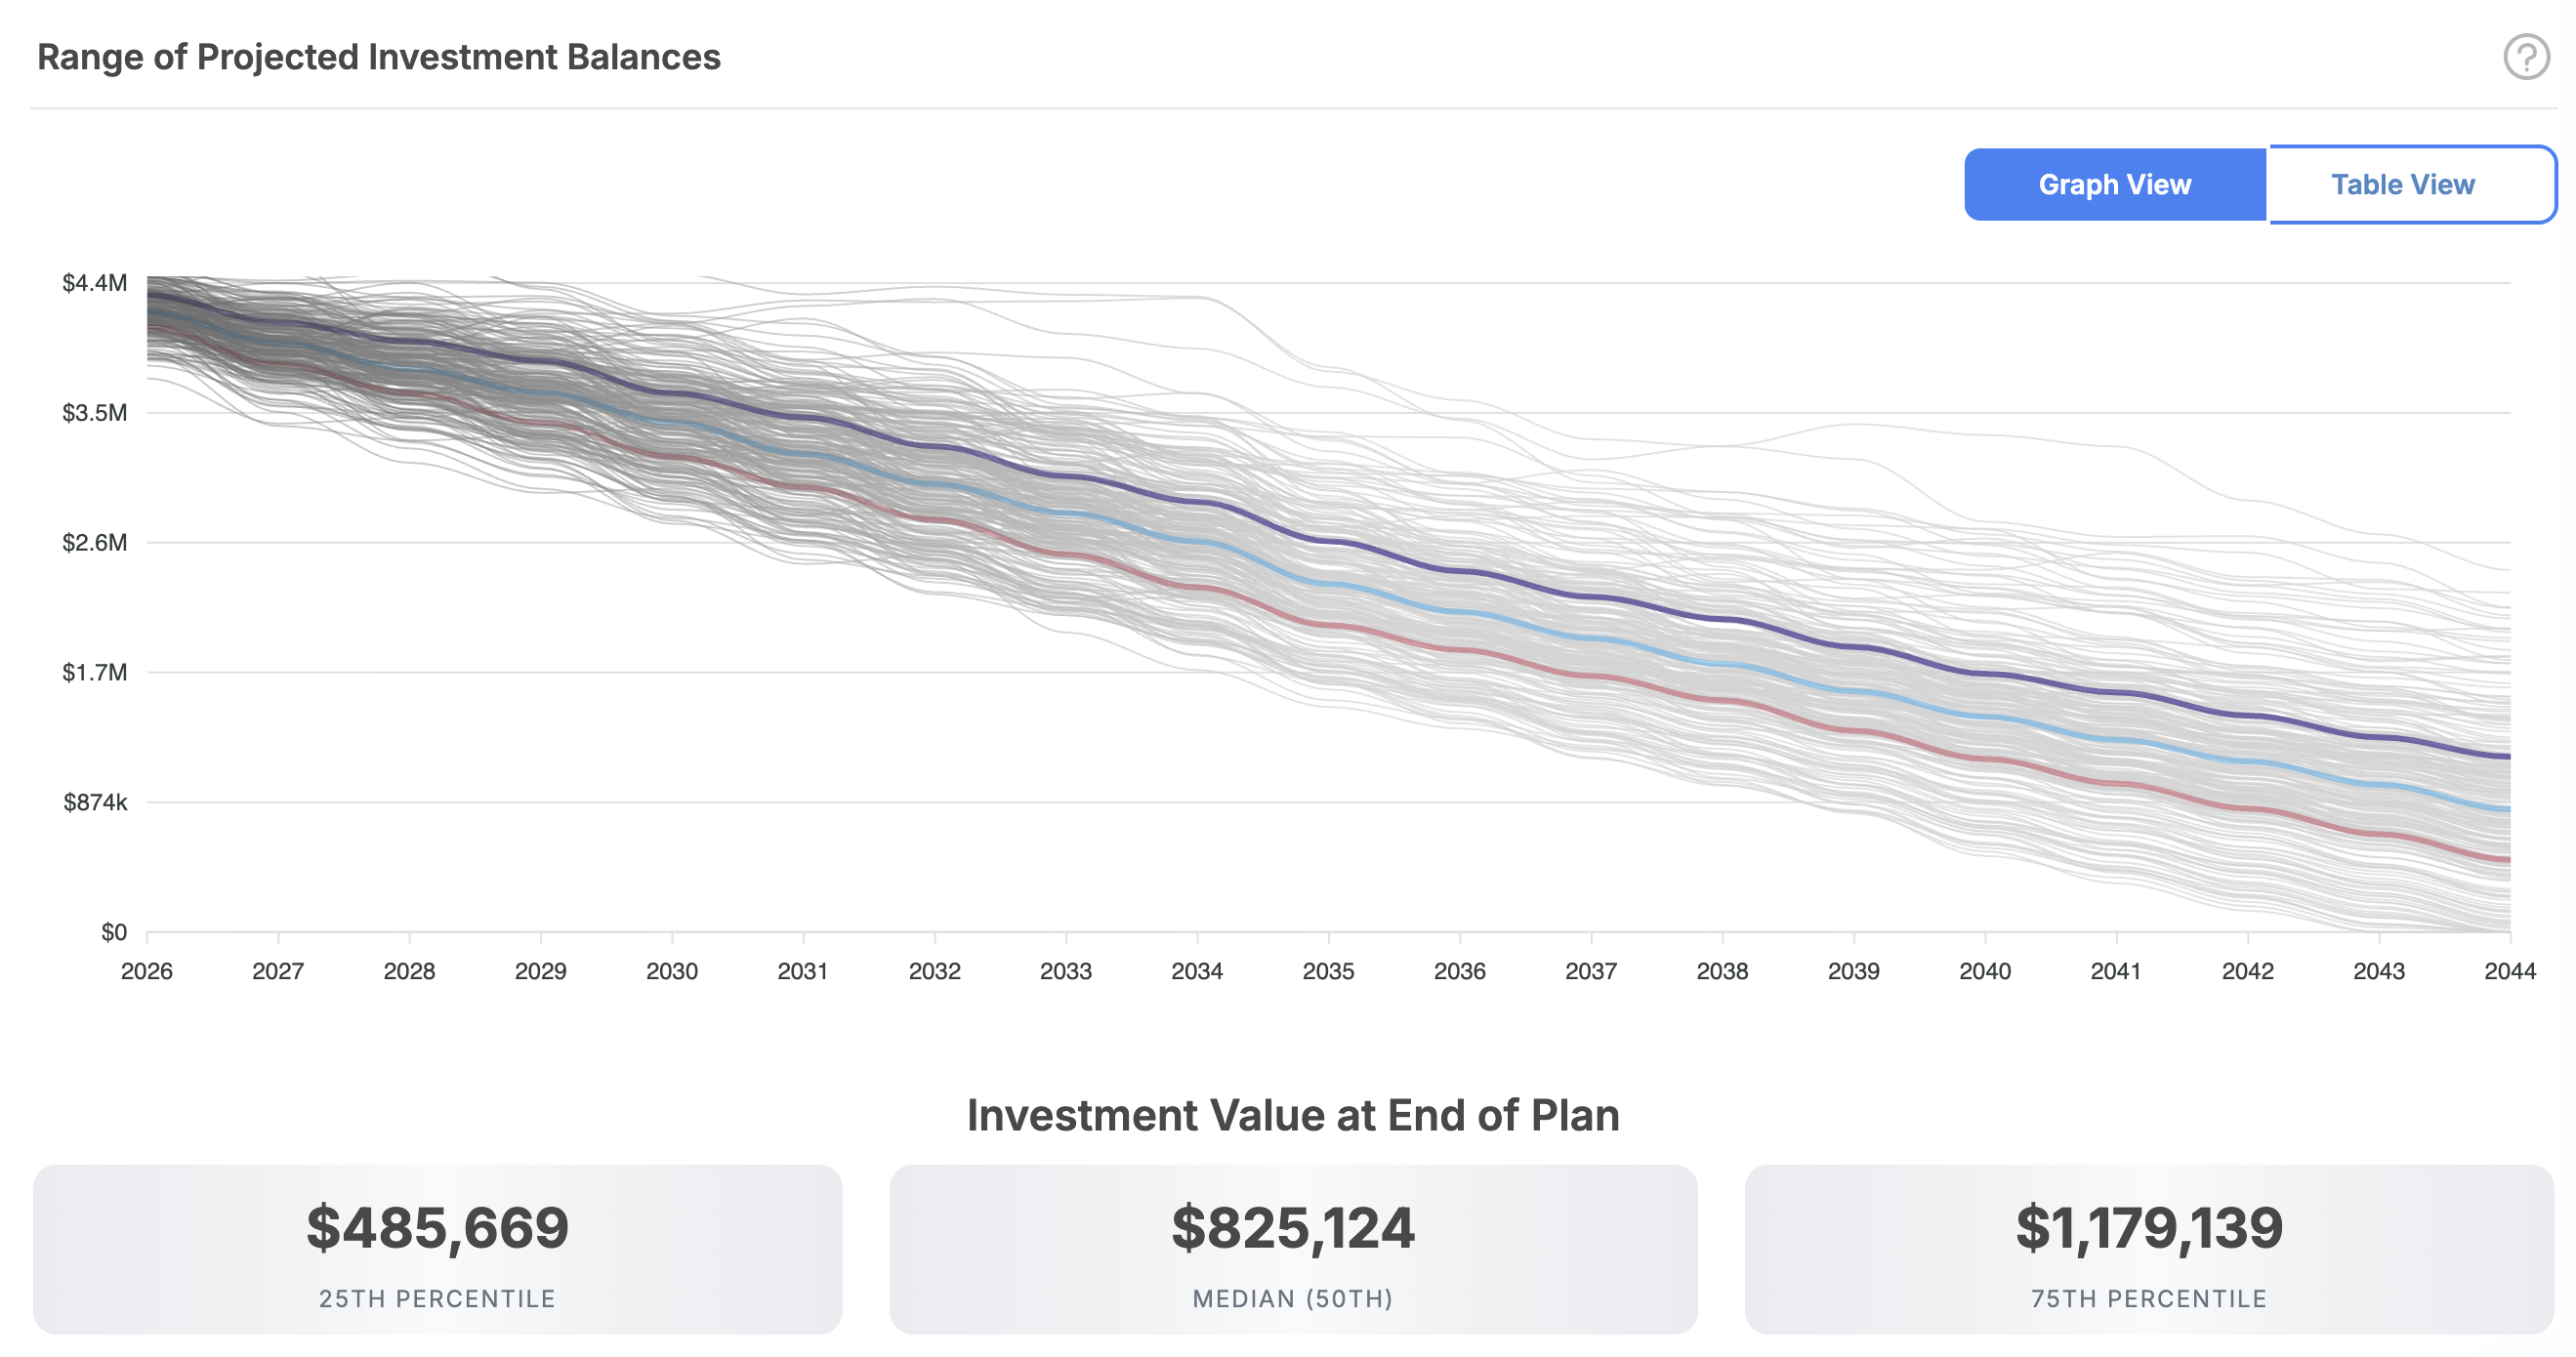
Monte Carlo analysis tests your retirement plan across many different possible investment return paths instead of assuming your portfolio earns the same return every year.
WealthTrace runs 1,000 Monte Carlo trials, with returns varying in each one while the plan continues to account for income, expenses, taxes, withdrawals, investment balances, and other assumptions.
If 900 of those 1,000 trials successfully fund the plan through the end of the projection, the result is a 90% probability of success. That does not mean there is exactly a 10% chance you will run out of money. Your actual retirement will follow one path, while future returns, spending, taxes, and other assumptions will change over time.
Monte Carlo Is About Modeling Uncertainty
Monte Carlo analysis is also used outside of retirement planning to model uncertainty in areas such as weather forecasting, engineering, insurance, and finance.
The same concept applies to retirement planning: running many possible scenarios provides a more useful view of risk than relying on one fixed projection.
Is 90% Good Enough?
There is no single success probability that is right for everyone.
Instead of looking at your retirement plan's success probability as the determining factor, focus on the change up or down that you see when you run a scenario with something extra added on to your plan. That could be retiring a year earlier or increasing assumed annual living expenses. In practice, we think of this as your plan's sensitivity.—Dan Rooker, co-CEO of WealthTrace
A retiree with most essential expenses covered by Social Security and a pension has more flexibility than someone who depends heavily on portfolio withdrawals. Spending also matters. Someone with significant travel, entertainment, and other discretionary expenses has more room to adjust if markets perform poorly.
Legacy goals can change the answer too. If leaving a large estate is important, maintaining a higher probability and larger projected ending balance can matter more. Someone who is comfortable spending down more of the portfolio can make different choices.
The percentage only makes sense in the context of the full plan.
Why 100% Is Not Always Better
A 100% success probability sounds ideal, but getting there can come at a cost. You might have to work longer, spend less in retirement, reduce travel, or leave behind far more money than you intended.
Suppose a retiree has a 90% probability while spending $100,000 per year. Reducing spending to $80,000 could push the probability much higher.
That does not automatically make the lower-spending plan better. The real question is whether giving up $20,000 of annual spending is worth the additional margin of safety.
Retirement planning is about tradeoffs.
WealthTrace Planning Tip: If your probability is already strong, test what happens when you increase discretionary spending, retire earlier, or add another financial goal.
Use Quick Scenarios to Compare Decisions
A lower probability is not automatically a worse result if the change reflects a deliberate choice.
For example, adding $15,000 per year of travel could reduce a plan from 95% to 88%. Retiring two years earlier could have a similar effect. The important question is whether the benefit of that decision is worth the additional risk.
WealthTrace includes quick scenario controls directly in Monte Carlo so you can test changes without rebuilding the plan. This makes it easier to compare different assumptions against the same base plan and see which decisions have the greatest impact.
WealthTrace Planning Tip: Use quick scenarios to test changes one at a time, such as higher spending, a different retirement age, life expectancy, or another major goal.
Spending Flexibility Matters
A headline probability cannot fully capture how you will respond if conditions change.
If markets fall substantially, many retirees can delay a large purchase, travel less for a year, reduce gifts, or cut back on other discretionary expenses. Someone with flexible spending is in a very different position from someone whose expenses are almost entirely fixed.
WealthTrace allows you to apply spending guardrails to Monte Carlo simulations. Guardrails can increase retirement living expenses when the portfolio rises above an upper threshold and reduce spending when it falls below a lower threshold.
This can provide a more realistic view for retirees who expect to adjust spending during strong or weak market periods.
WealthTrace Planning Tip: Apply guardrails to see how flexible spending can affect your results in both stronger and weaker market scenarios.
Look Beyond the Headline Number
Success probability is important, but it should not be the only result you review.
Also look at projected investment balances, income, expenses, taxes, withdrawals, and ending assets. Two plans can both show a 90% probability and still look very different underneath.
It is also useful to understand what is driving the result. Retirement age, spending, life expectancy, asset allocation, inflation, and other assumptions can all materially affect the probability.
Compare retirement decisions with Monte Carlo scenarios.
WealthTrace helps you test retirement age, spending, life expectancy, investment returns, guardrails, taxes, withdrawals, and legacy goals in one plan.
Start Free Trial
Test plan sensitivity.
The Bottom Line
A 90% retirement success probability can represent a strong plan, but the number needs context.
Your spending needs, guaranteed income, investments, life expectancy, legacy goals, and ability to adjust all affect how you should interpret the result.
The goal is not to chase the highest possible percentage. It is to understand the risks in your plan and make informed decisions about the tradeoffs.
Monte Carlo simulations, quick scenarios, and spending guardrails can help you see how different choices and changing market conditions affect your retirement plan.